
UXR Impact Tracker
What this tool does:
I have found that on most of the teams I have worked on, once a recommendation leaves a readout, it's nearly impossible to trace whether it actually changed anything downstream. I built the UXR Impact Tracker to solve this problem. The tool takes a single deck as its primary input and automatically consolidates team impact as a result of the research recommendations. This tool:
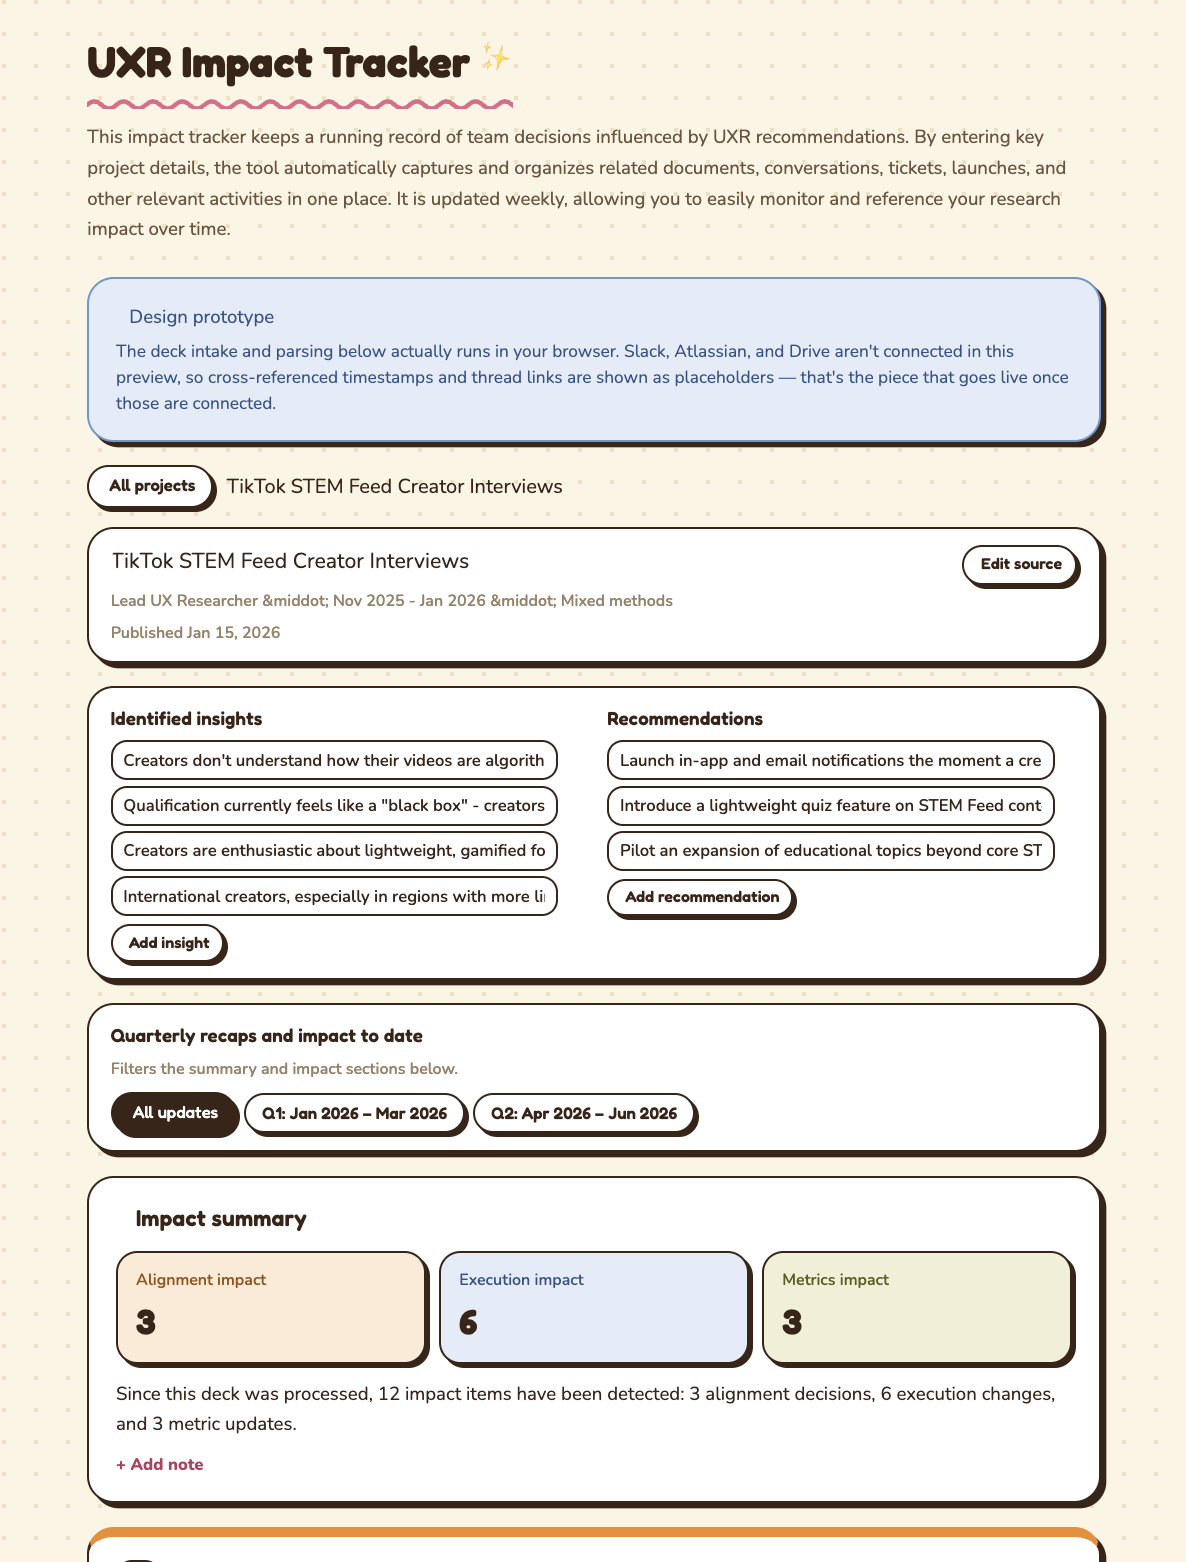
Identifies key insights and UXR recommendations: I designed intake around three input paths so the tool fits into however a researcher already shares work, rather than forcing a new format. A researcher can paste the deck text directly, upload one or more files, or attach a link to the findings.
Follows relevant team updates to track impact: I added the ability to add team members and relevant chat channels because impact almost never shows up in the deck itself; it shows up in the conversations and documentation that follow it. Adding the people (e.g., a PM and an engineering lead pulled from a workplace-directory search) and the channels most likely to carry follow-through (e.g., a launch-specific Slack channel) gives the tool a defined scope to watch and keep track of, rather than the entire company.
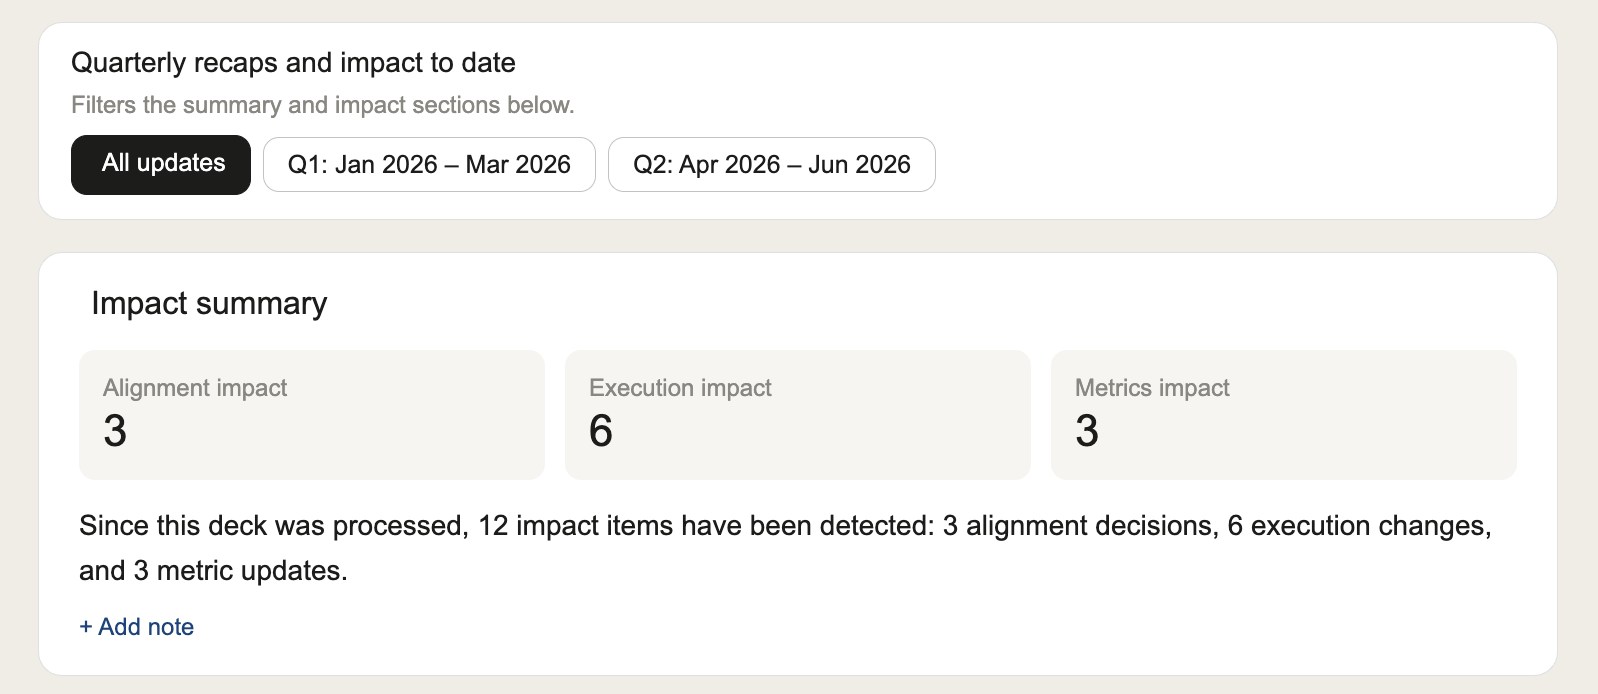
Organizes up to date information: I made the deck's publish date a required input specifically to power quarter-over-quarter recap views, since "did this land" is a different question at week one versus month four. Once a publish date is set, the tool auto-generates dated quarter buttons (e.g., "Q1: Jan 2026 – Mar 2026"), which helps organize up to date information for leadership updates and performance reviews.
Detects downstream activity into one of three categories, so impact reads as a decision, not a data dump.
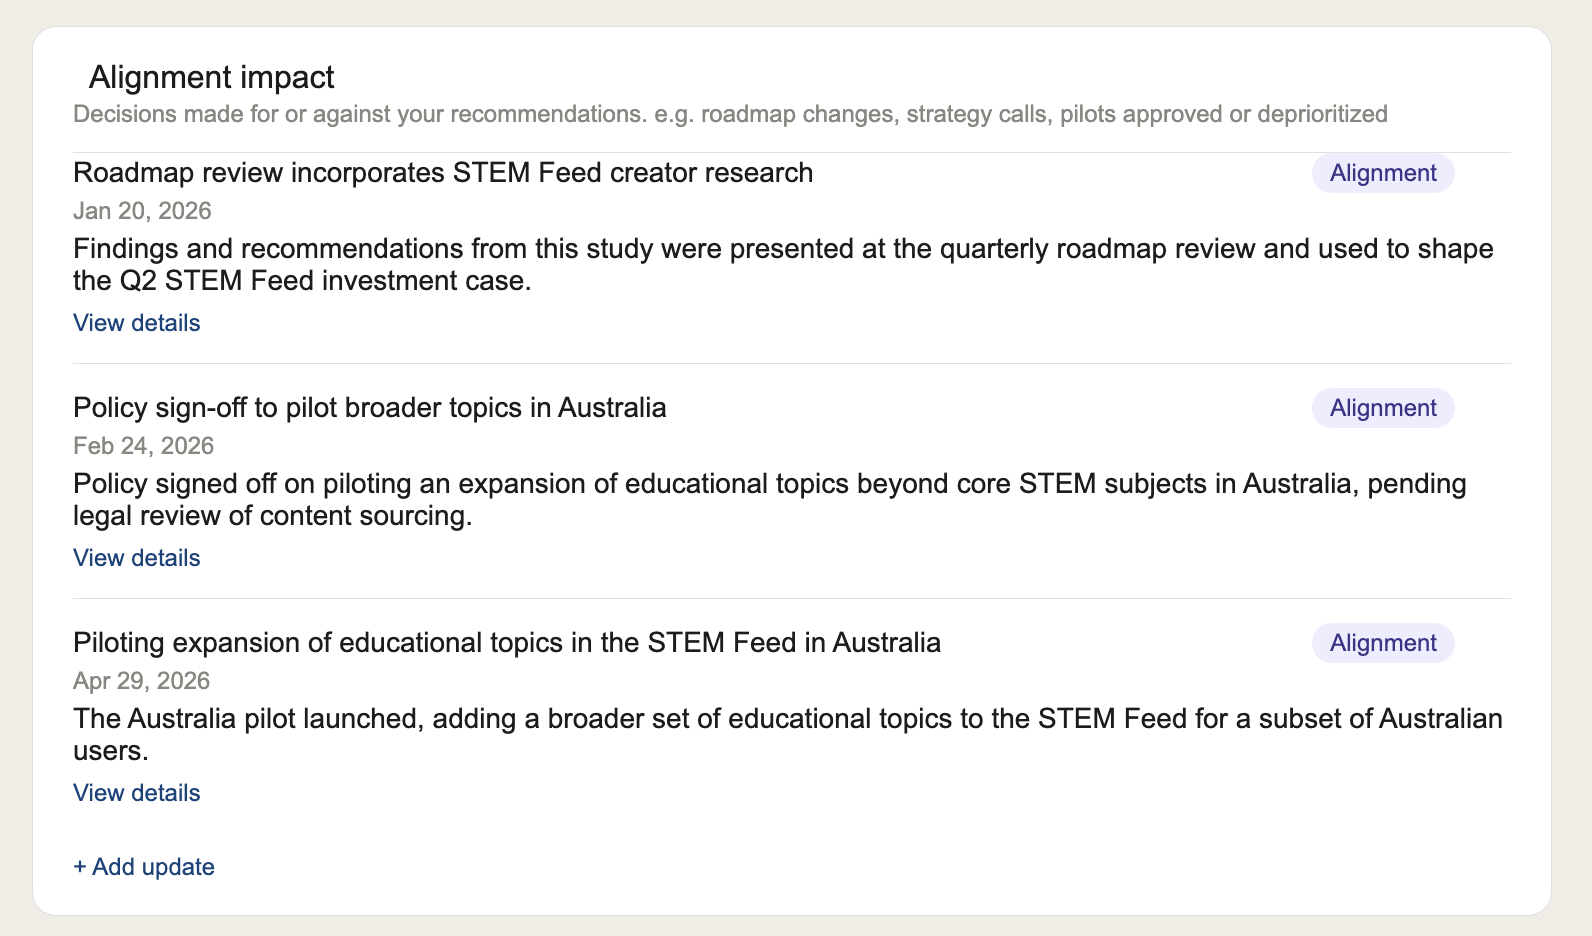
Alignment impact captures decisions made for or against a recommendation (e.g., a policy sign-off to pilot expanded content topics in a new market).
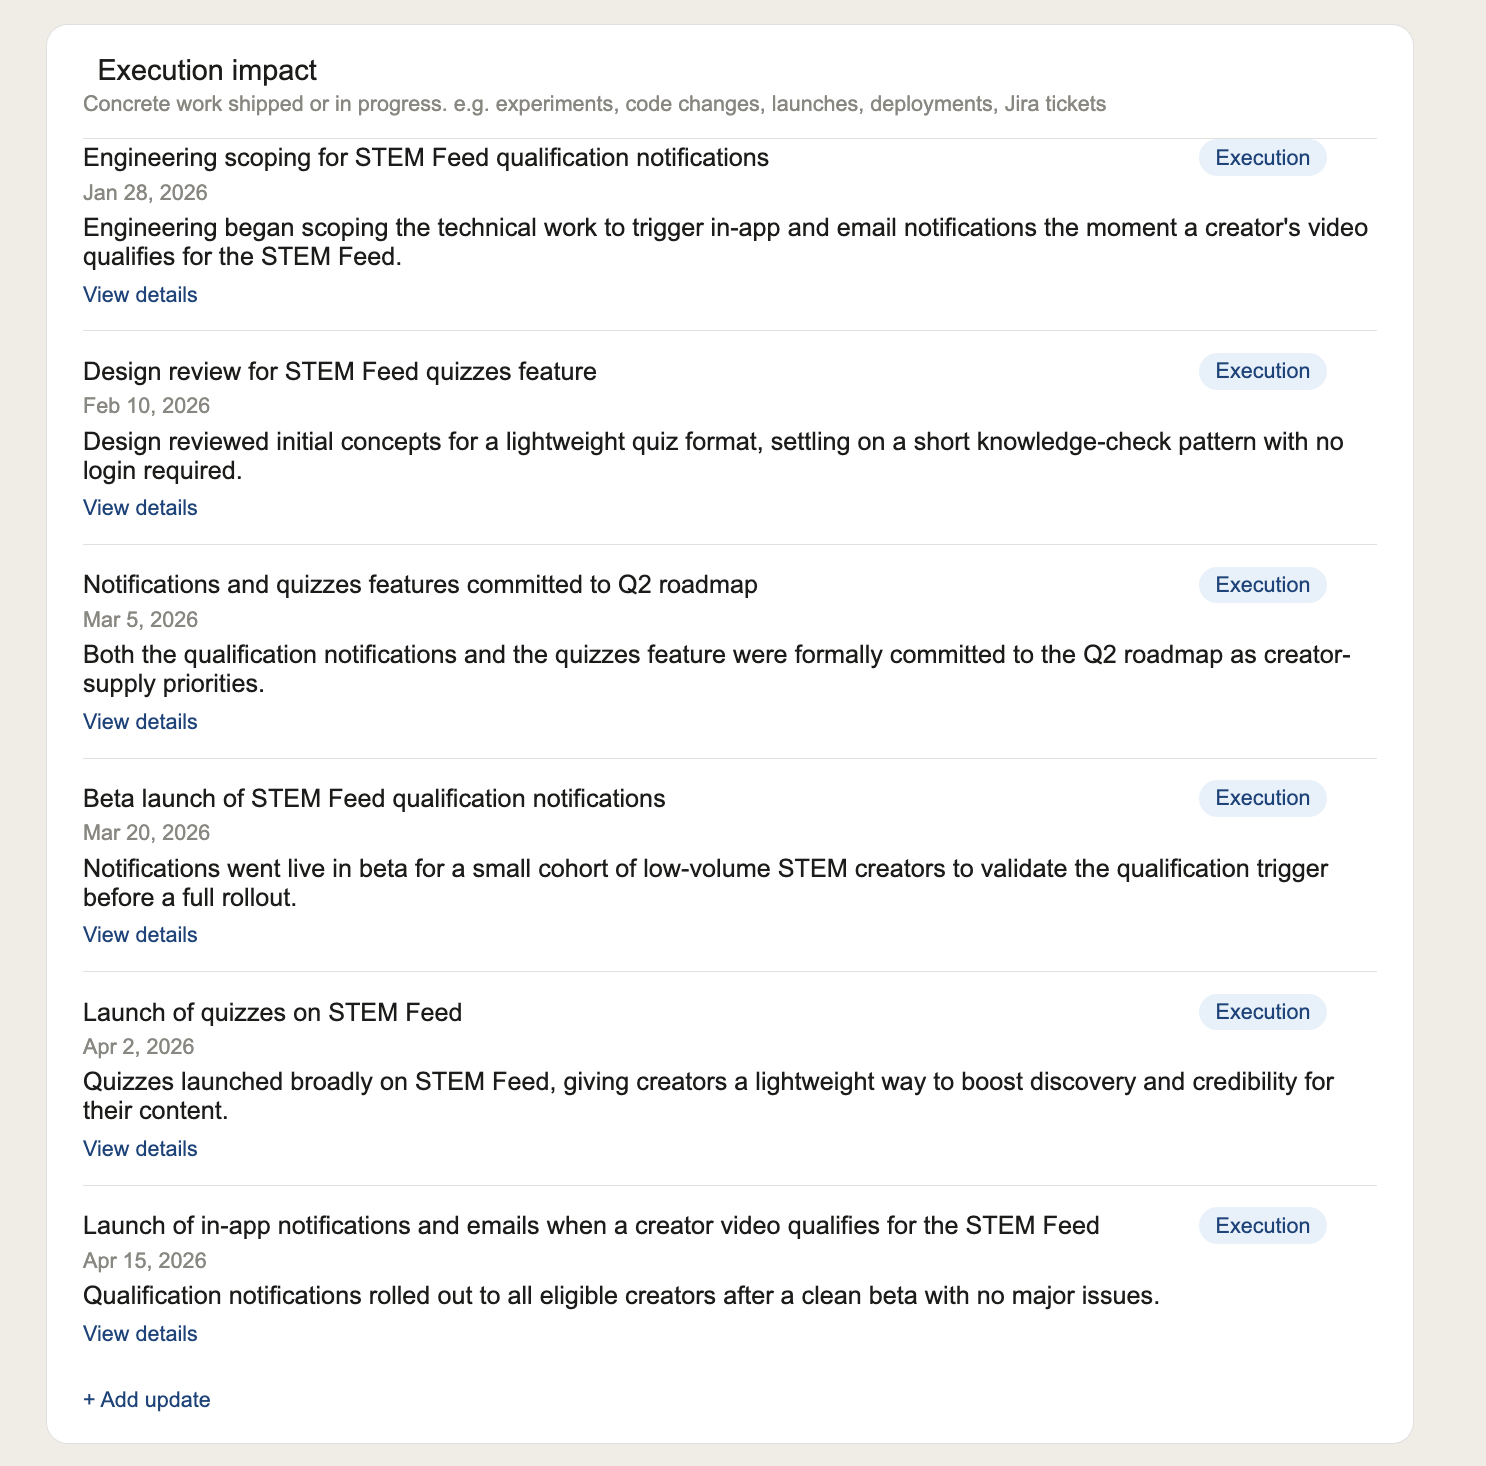
Execution impact captures concrete work shipped or in progress as a result (e.g., an engineering ticket scoping a notification trigger, or a feature beta launch).
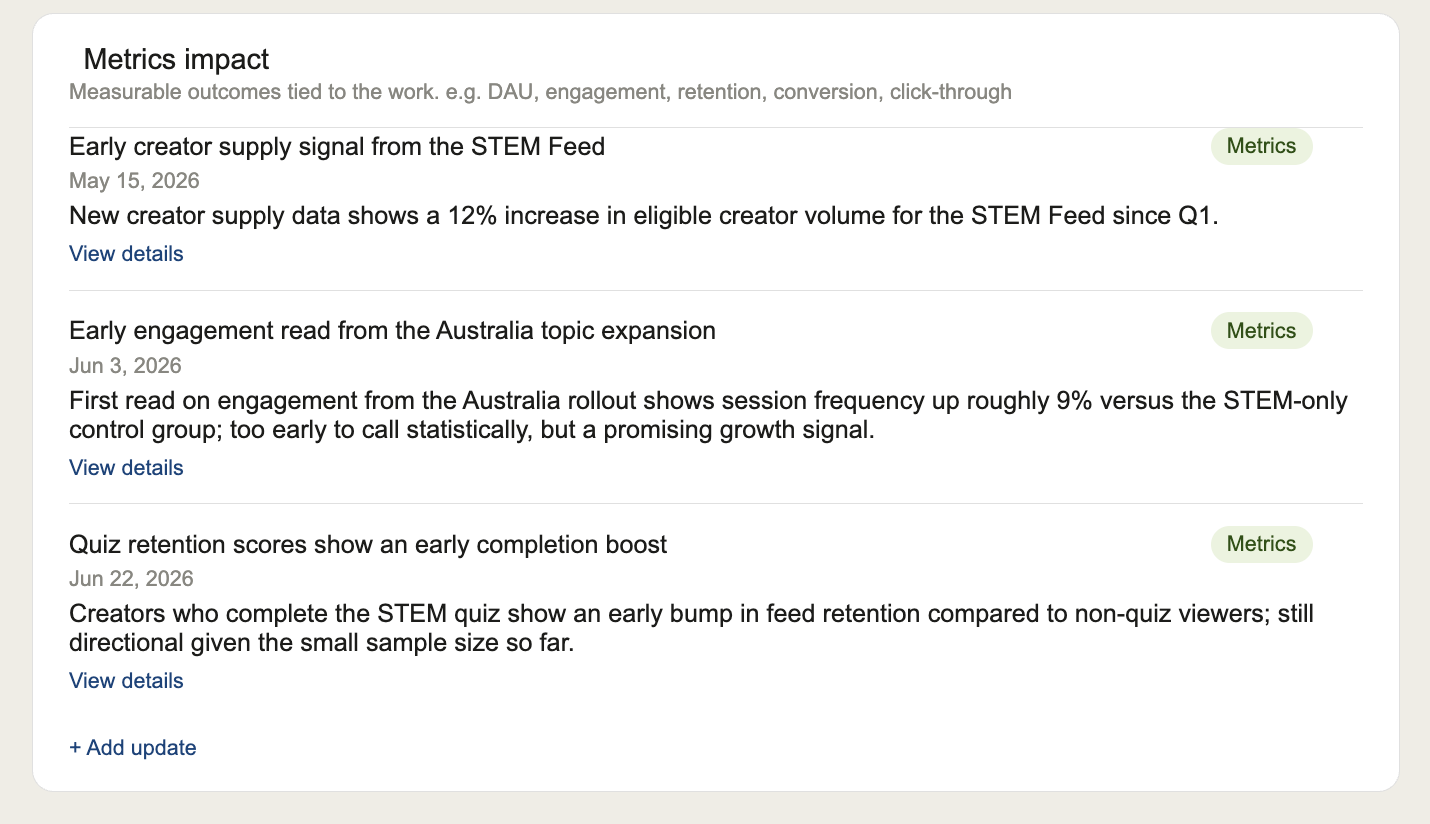
Metrics impact captures measurable outcomes tied back to the work (e.g., an early read showing a percentage lift in engagement for a pilot cohort versus a control group).
Scans weekly rather than a one-time export, and to flag what's new so a researcher doesn't have to re-read the entire history to find it. Any impact item dated within the last 24 hours of a scan is visually distinct (bolded header, colored border, "New" badge), so a researcher can open the tool on a weekly cadence and immediately see what changed since the last check, rather than re-auditing every item.
🗂️ Consider structuring decks with a consistent "Key Findings" / "Key Recommendations" heading convention, since the extraction logic is heading-driven. I found that decks using clear, literal section headers parsed cleanly on the first pass, while decks that buried recommendations inside prose required a fallback matching strategy — standardizing deck structure upstream would remove that ambiguity entirely.
Why This Matters:
I built this tool because "impact" is the hardest thing for a researcher to substantiate, and the burden of proving it usually falls on the researcher alone, well after the moment of influence has passed. Recommendations get delivered in a readout, partially adopted in a roadmap conversation three weeks later, partially built over a quarter, and only sometimes show up in a metric, and by the time someone asks what the research actually did, the trail across Slack threads, tickets, and docs has usually gone cold.
I designed the tool to shift impact-tracking from a retrospective, effortful reconstruction into a passive, ongoing record, because asking cross-functional partners to self-report their use of my research isn't a sustainable system. The tool is explicitly built so that no one outside the researcher has to do anything differently — no partner has to remember to tag a ticket or loop the researcher into a thread; the tool does the watching.
I built the three-category structure (alignment, execution, metrics) specifically because those are the three questions I'm actually asked in performance reviews and roadmap discussions, and I wanted the evidence organized the way it gets consumed. Being able to say three decisions, six shipped changes, and three early metric reads trace back to a given recommendation is a fundamentally different, more credible claim than describing a study as generally helpful.
I see this as a template for a broader shift in how research teams justify their function: from narrative self-advocacy to a running, dated, source-attributed evidence trail. A tool like this doesn't just help me individually — it gives a research org a consistent, low-effort way to answer whether the function is worth the investment, using the same kind of evidence a PM or engineer would already point to for their own work.
try playing around with the UXR Impact tracker yourself! Most updated version:
Example (images from version 1): How I'd Use It for my studies
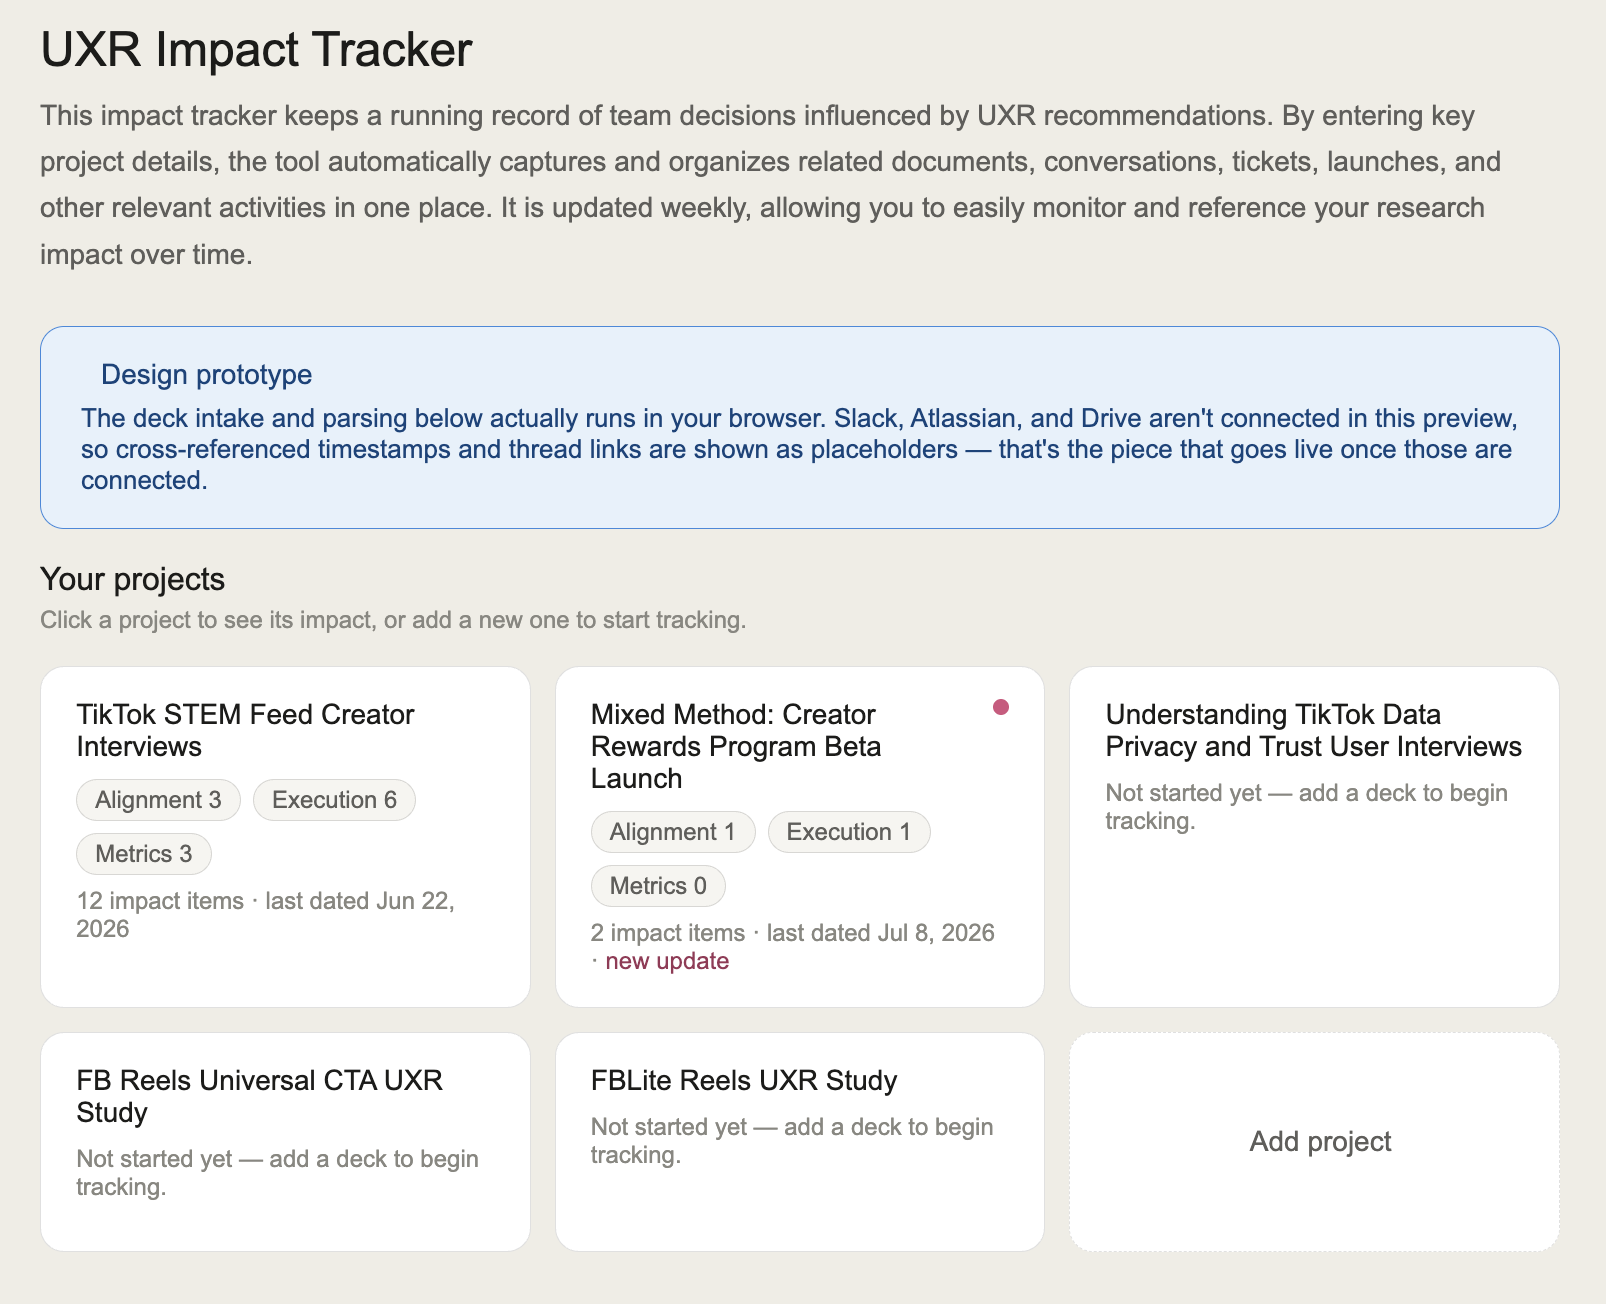
Home: All projects at a glance
I built a dashboard view specifically for tracking multiple studies at once rather than assuming any one project lives in isolation, since in practice I have several UXR studies running in parallel. Each project card surfaces its alignment, execution, and metrics counts at a glance and flags a colored dot when something new has landed in the last 24 hours, so I can tell which project needs my attention before opening any of them individually.
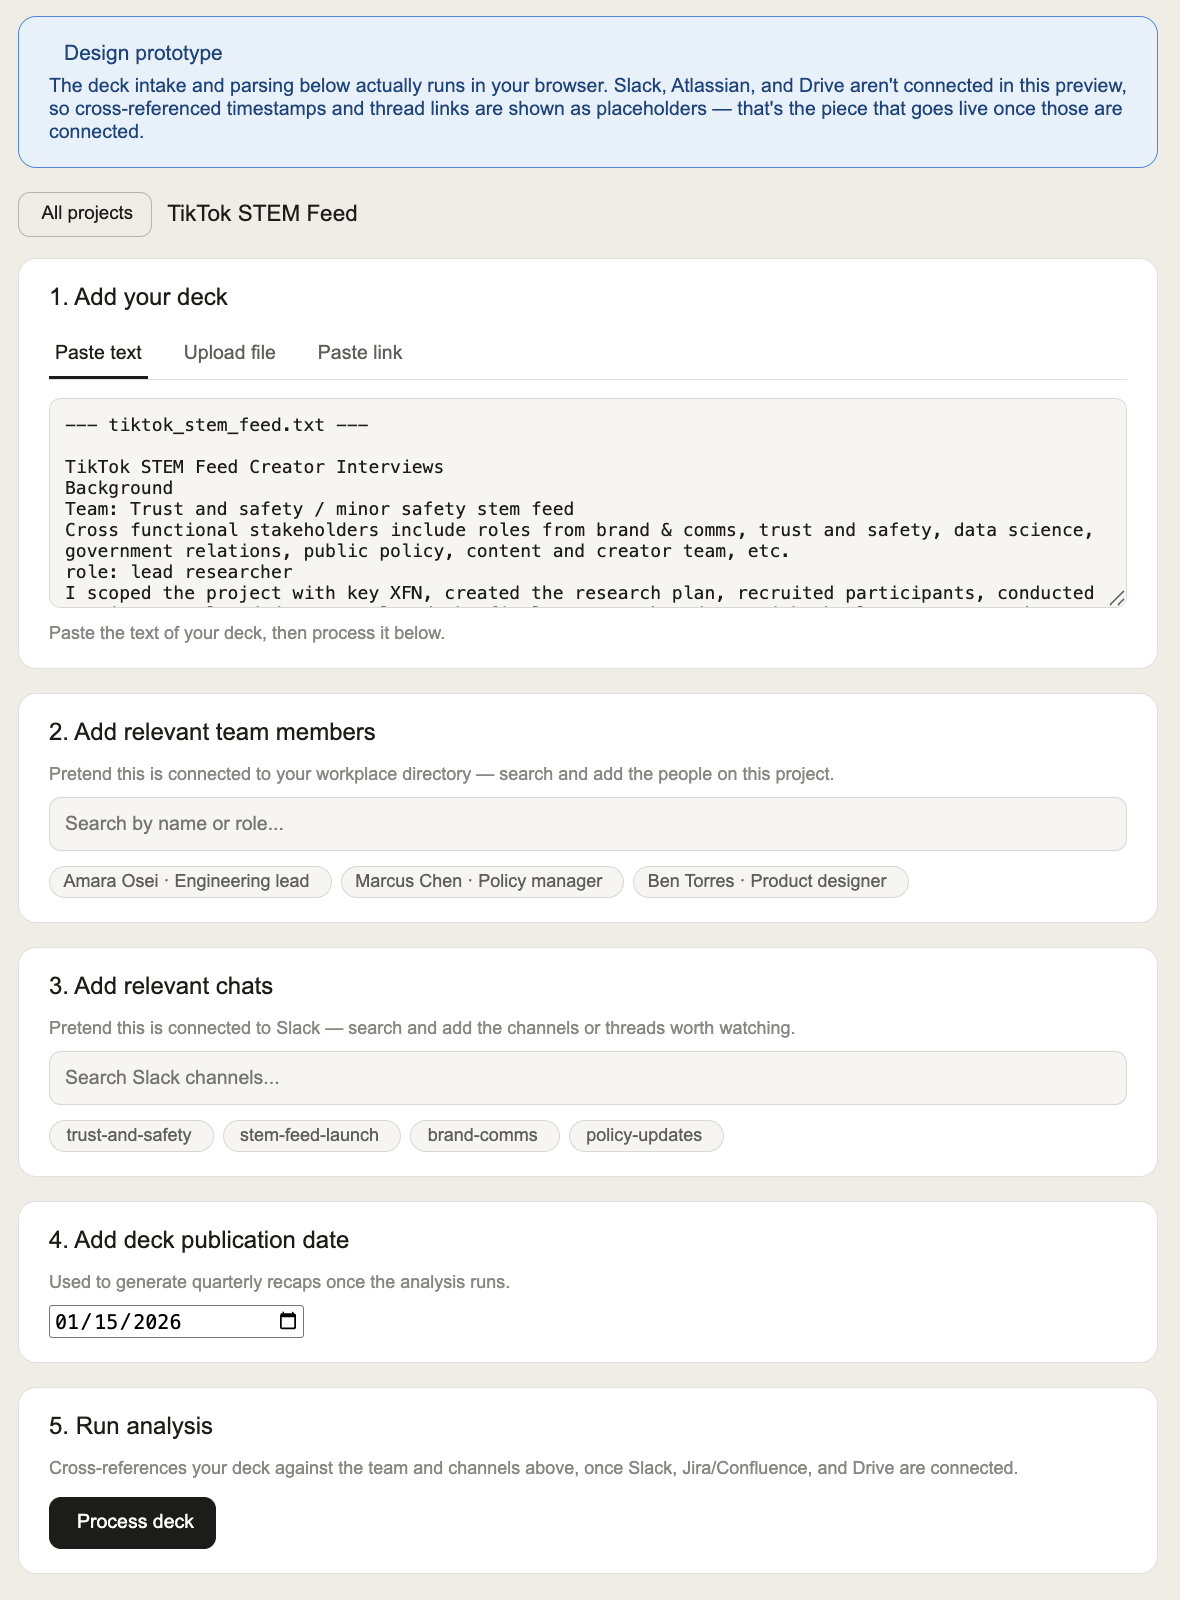
Researcher Sets the Scope
Input information I already have on hand after any study: the deck itself, the XFN who received it, and the channels most likely to carry follow-through (e.g., a launch-specific Slack channel). No one outside the researcher has to change their workflow for the tool to work.
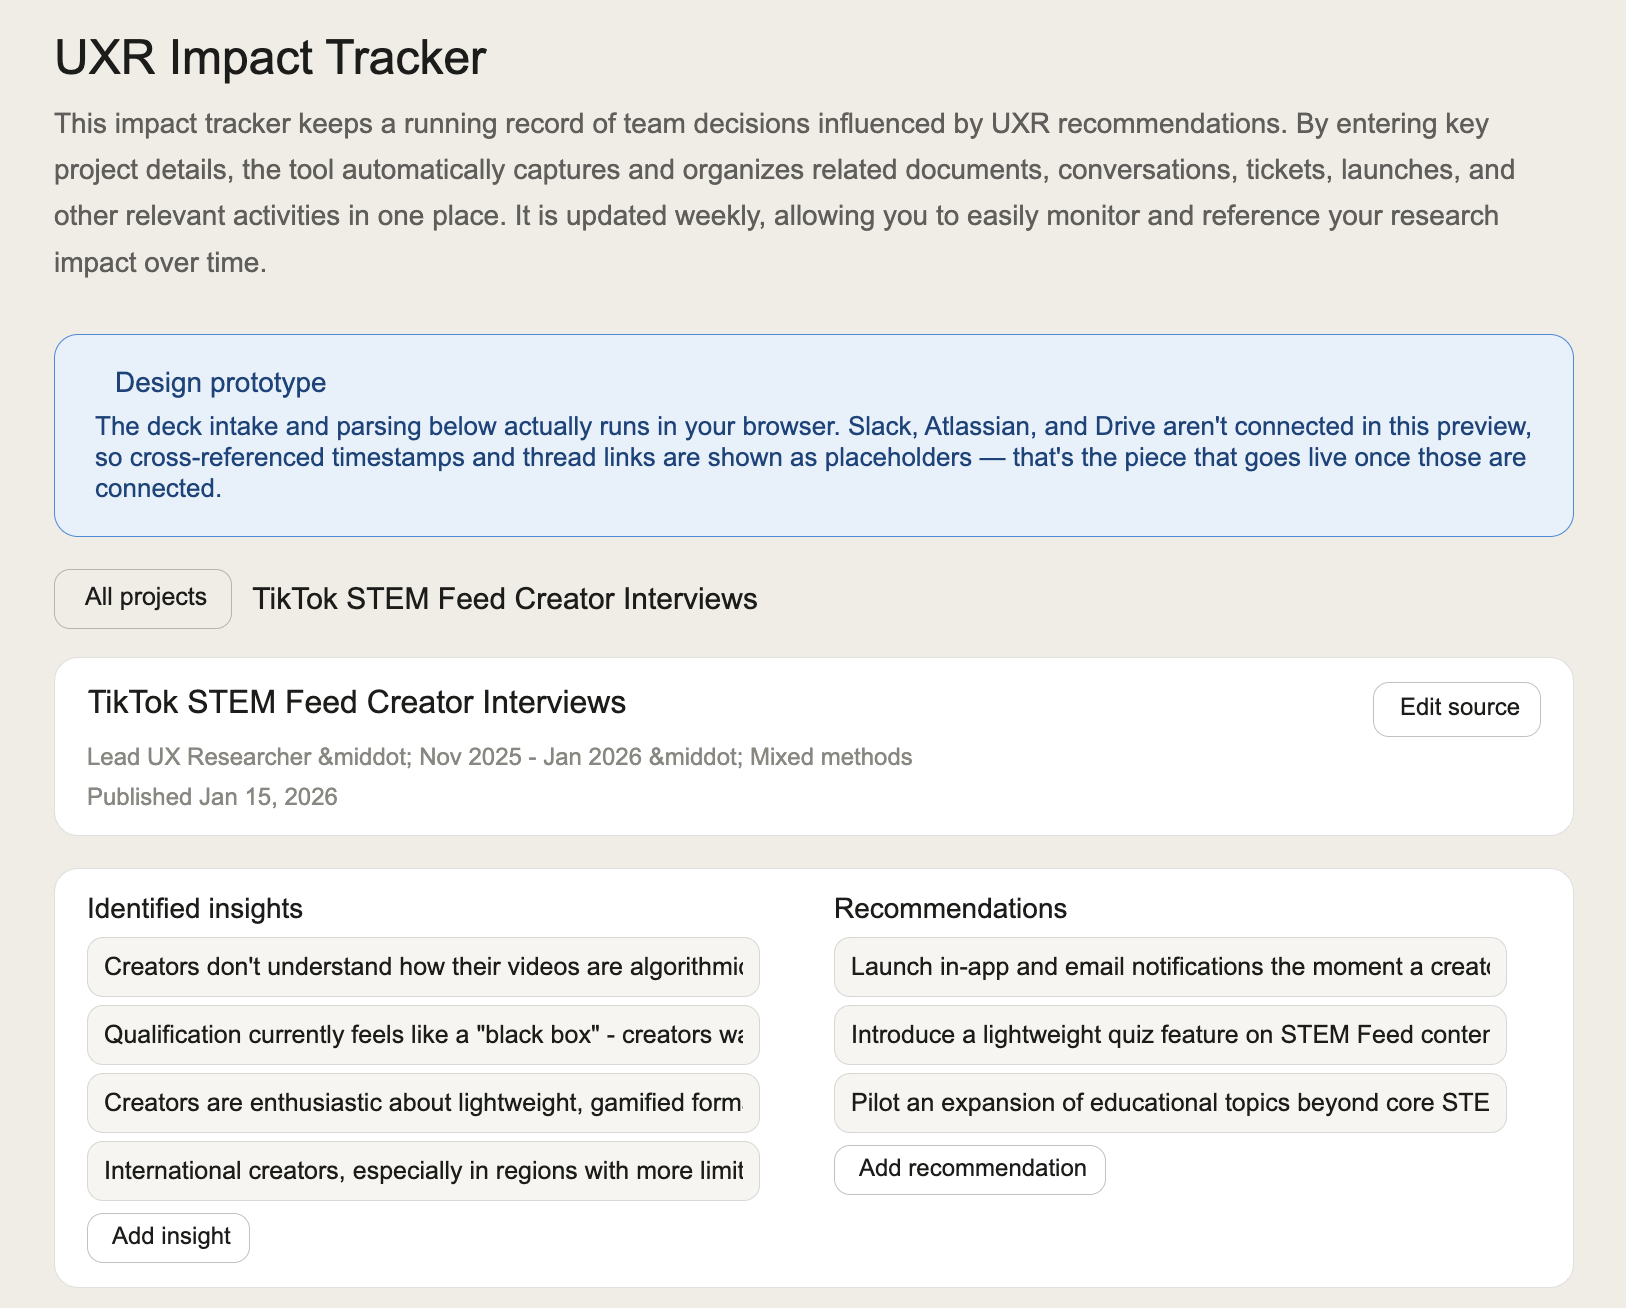
Tool Identifies deck information
The tool auto-extracts findings and recommendations directly from the deck (e.g., pulling my STEM Feed study's three recommendations verbatim) and leaves them fully editable, so I can correct or sharpen the tool's read before it becomes the basis for everything tracked downstream.
Tool provides a Summary
The tool provides a summary of all impact updates, with information organized into quarters and information split between alignment, execution, and metric impact.
Alignment Impact
This section isolates team decisions made for or against my research recommendation (e.g., a policy sign-off to pilot expanded content topics in a new market), which is typically the fastest evidence to appear and the first thing I’m asked about in a roadmap conversation.
Execution impact
This section tracks concrete work shipped or in progress as a result of the recommendation (e.g., an engineering ticket scoping a notification trigger, or a feature's beta launch), replacing the manual work of piecing together build status from scattered tickets and stand-ups.
Metric Impact
This section surfaces measurable outcomes tied back to the work once they exist (e.g., an early read showing engagement up versus a control group), and it's deliberately the slowest category to fill in, since results lag behind decisions and shipped work rather than arriving alongside them.
What It Needs To Work (Caveats):
I built this as a working prototype, not a finished product, and the gap between the two is entirely about integration, not concept. The parsing, classification, and quarter-scoping logic all run for real in the browser; what's mocked is the connection to the systems where the actual evidence of impact lives.
The tool assumes read access to the workplace directory, Slack, and a documentation/ticketing layer (e.g., Jira and Confluence), none of which are live in this build. In the prototype, team-member and channel search return results from a static mock list, and every impact item's "source" (a Slack quote, a Jira ticket, or a Confluence doc, each with an owner and a link) is generated by matching keywords against a small hand-built reference set rather than querying a real API.
The classification engine is a keyword-scoring heuristic, not a trained model, so its accuracy is bounded by how explicitly a deck's language maps to alignment, execution, or metrics language. I chose this approach deliberately for a client-side prototype with no backend (e.g., a mention of "roadmap" or "pilot" scores toward alignment, while "%" or "retention" scores toward metrics), but it will misclassify content that doesn't use those signal words, which a production version would need to handle with either a larger keyword library or a small classification model.
How I Built This With AI:
I used Claude, working in Cowork mode, as a hands-on prototyping partner rather than a code-generation shortcut. I directed every design decision and iterated on the output the same way I'd iterate on a Figma prototype with an engineer. The build happened in a single self-contained HTML/CSS/JS file with no backend, which let me go from a rough idea to a clickable prototype within the same working session rather than waiting on a separate build cycle.
I drove the build through explicit, incremental product decisions rather than a single upfront spec, which mirrors how I'd actually scope a research tool with an engineering partner. I started with a single input (paste a deck, see a summary) and prompted changes along the way, each step shipped as a working version I could react to before specifying the next (e.g., I only added the 24-hour "new" highlight after seeing the impact list render with no way to tell what had actually changed recently).
I made specific, opinionated calls on the underlying logic rather than accepting default behavior, the same way I'd push back on an engineering estimate that didn't match user needs. When the "new" highlighting first anchored to when the deck was scanned rather than to the date the update actually occurred, I corrected the logic so a change from January 20th only reads as new until January 21st, regardless of when someone opens the tool. The distinction matters because a researcher checking in sporadically shouldn't see three-month-old news relabeled as fresh.
I used AI to close a build-skill gap, not a judgment gap. The input and output information architecture are decisions I made, while the AI handled implementation and let me test my own product logic against real data in minutes instead of days. I fed it my own past deck (the TikTok STEM Feed Creator Interviews study) as a real test case rather than synthetic placeholder text, which surfaced real bugs, such as when recommendations weren't extracting at all under my deck's original heading format, something I wouldn't have caught with fabricated demo content.
🤖 Consider AI-assisted prototyping for any internal research-ops tool before requesting engineering time, since a working, testable prototype changes the scoping conversation. Walking into a conversation with a functioning demo, rather than a written proposal, let me validate the concept, catch usability issues (e.g., missing edit controls, unclear quarter labels), and refine the requirements before asking for any real engineering investment.
Future Iterations
I scoped this build as a click-through prototype to validate the concept before investing in real integrations, which leaves several concrete next steps if I were to take this further.
The impact categories can be more precise by leveraging an LLM -based classifier. A finding like "the team quietly deprioritized the feature after the interviews" wouldn't score as alignment impact today, since it doesn't contain any of the literal keywords (e.g., "pilot," "roadmap," "decision", etc) the classifier checks for.
🧠 Consider replacing the keyword heuristic with an LLM-based classifier for category assignment and source-linking, since a model can reason about paraphrased or implicit impact language instead of relying on exact keyword matches.
Each project's impact is tracked in isolation today, which hides patterns that only show up across studies. If three separate studies each recommended more transparency into an algorithmic process, that repetition is a stronger signal than any single recommendation, but nothing in the current build would surface it.
🔗 Consider adding a cross-project view that clusters recurring recommendation themes across all of a researcher's studies, since a repeated recommendation across independent projects is one of the strongest arguments for prioritizing it.